Your Trading Journal at a Glance

Quickly access your trades, account balance, and performance insights—everything you need in one streamlined view.
Free forever.
No credit card required.
Screenshot of an online trading journal app named 'Trading Vault' showing the dashboard feature.
Performance Overview
Track Your Performance Instantly
See a snapshot of your net returns alongside a graph, giving you an at-a-glance view of your trading trajectory compared to the previous period.
Get started
Screenshot of an online trading journal app named 'Trading Vault' displaying core performance statistics for the current period.
Open and Closed Trades
Access Trades Instantly
Easily open and view your trades directly from the dashboard.
Get started
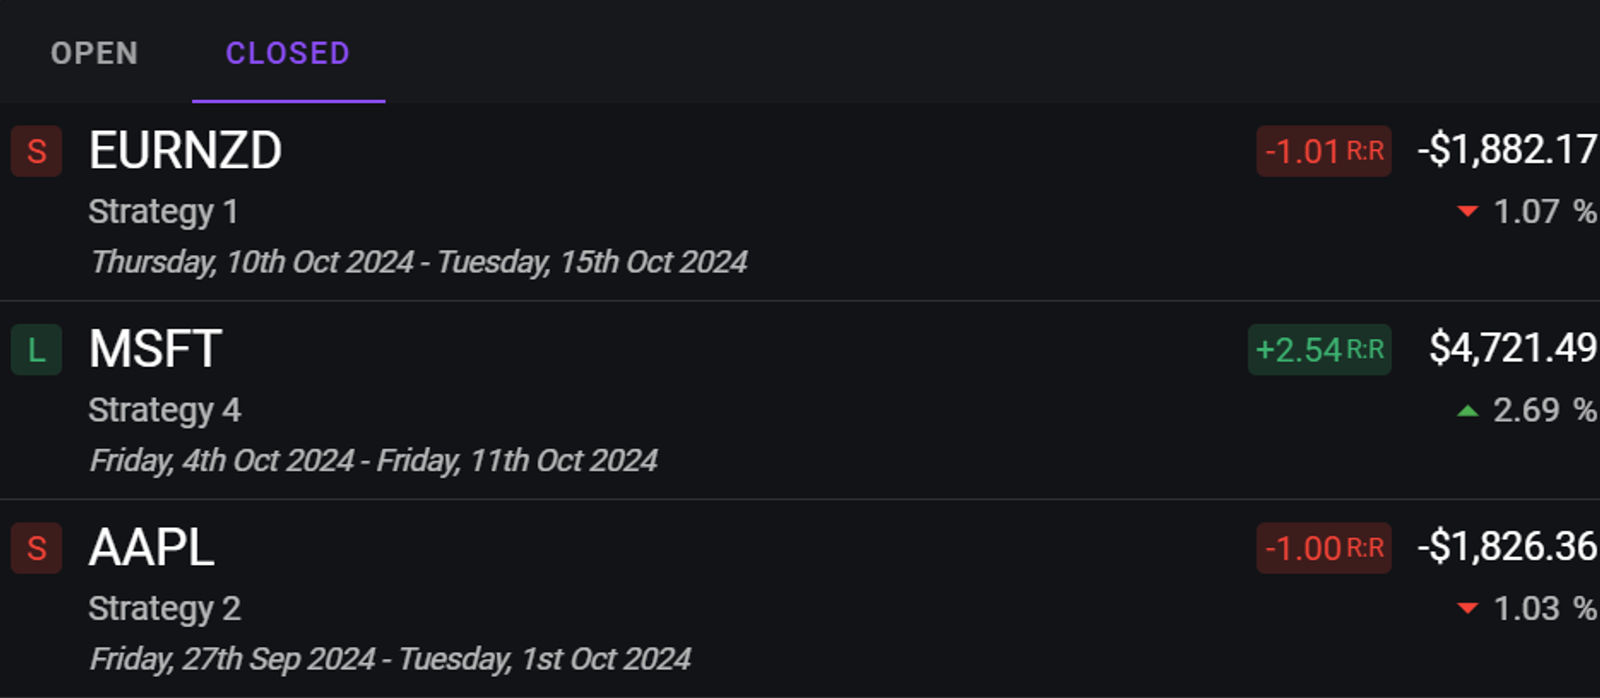
Screenshot of an online trading journal app named 'Trading Vault' showing a list of open and closed trades.
Account Balance
Visualize Your Equity Over Time
Track your account’s growth with a dynamic graph, zoomable to explore changes over time, along with a total balance summary.
Get started
Screenshot of an online trading journal app named 'Trading Vault' showing a line chart displaying the account balance over time.
Returns
Analyze Returns by Timeframe
Dive into detailed returns grouped by day, week, month, quarter, or year. Use toggles and zoom to explore specific trends.
Get started
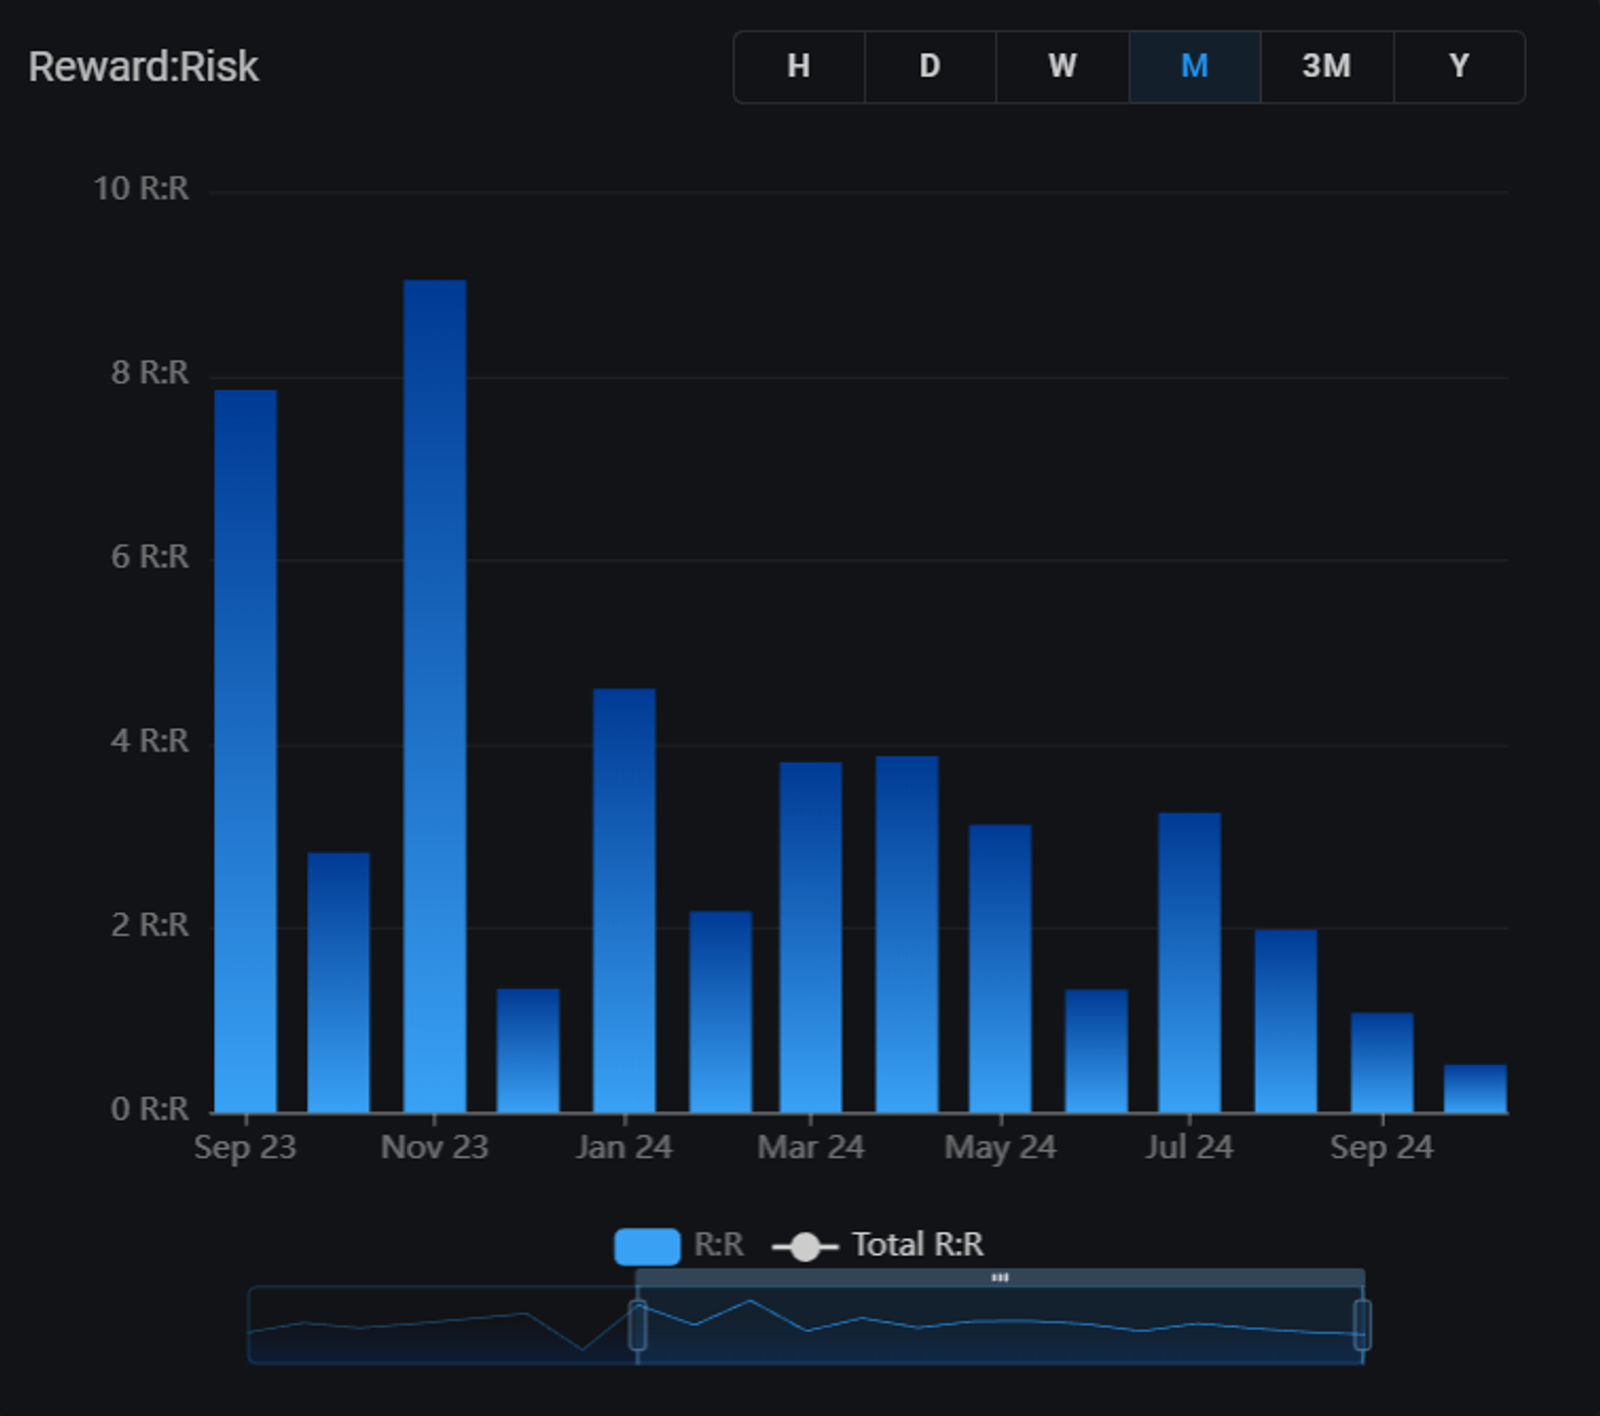
Bar chart illustrating monthly Reward-to-Risk (R) ratios over a selected time period in a trading app. The chart includes interactive elements for changing the time scale (daily, weekly, monthly, etc.) and a timeline slider for navigation. This approach provides context about the feature without tying it to specific data that may change frequently.
Monthly Breakdown
Daily and Weekly Performance at a Glance
View a calendar-style summary of your monthly trading results, making it easy to spot patterns and assess each day or week.
Get started
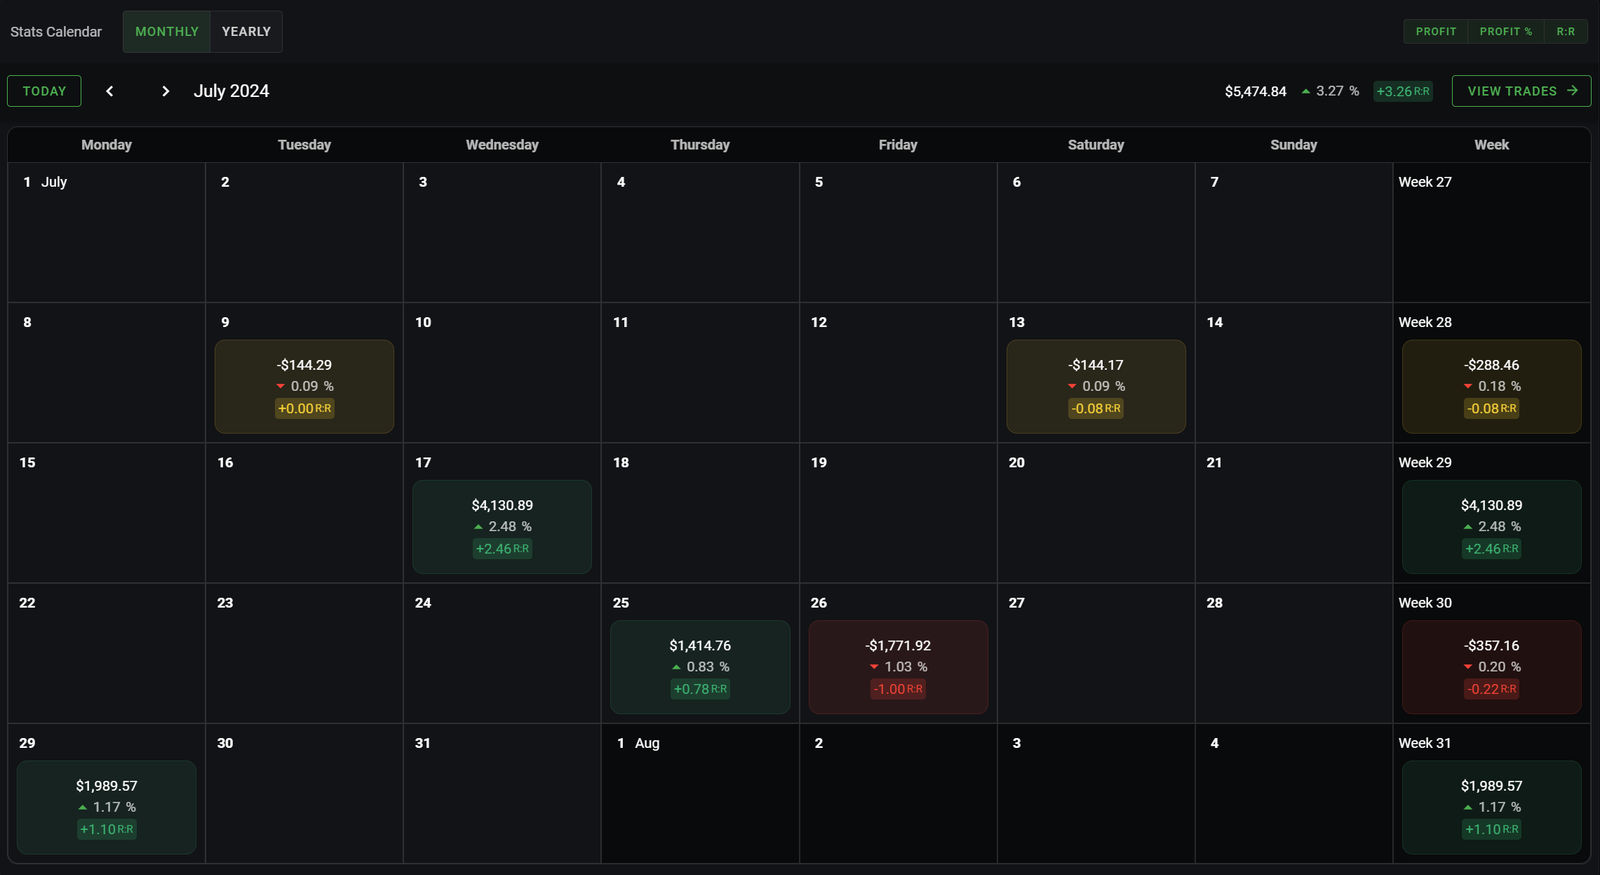
Screenshot of an online trading journal app named 'Trading Vault' displaying a monthly performance calendar for July 2024. It shows daily and weekly trade outcomes, including profits and losses in dollars, percentage changes, and reward-to-risk (RR) ratios. Highlighted days include gains of $4,130.89 with a +2.48% change and 2.46 RR on July 17, and losses such as -$1,771.92 with a -1.03% change and -1.00 RR on July 26.
Yearly Overview
See the Big Picture
Summarize your trading journey month by month with a yearly view, showing each period's total results for a comprehensive overview.
Get started
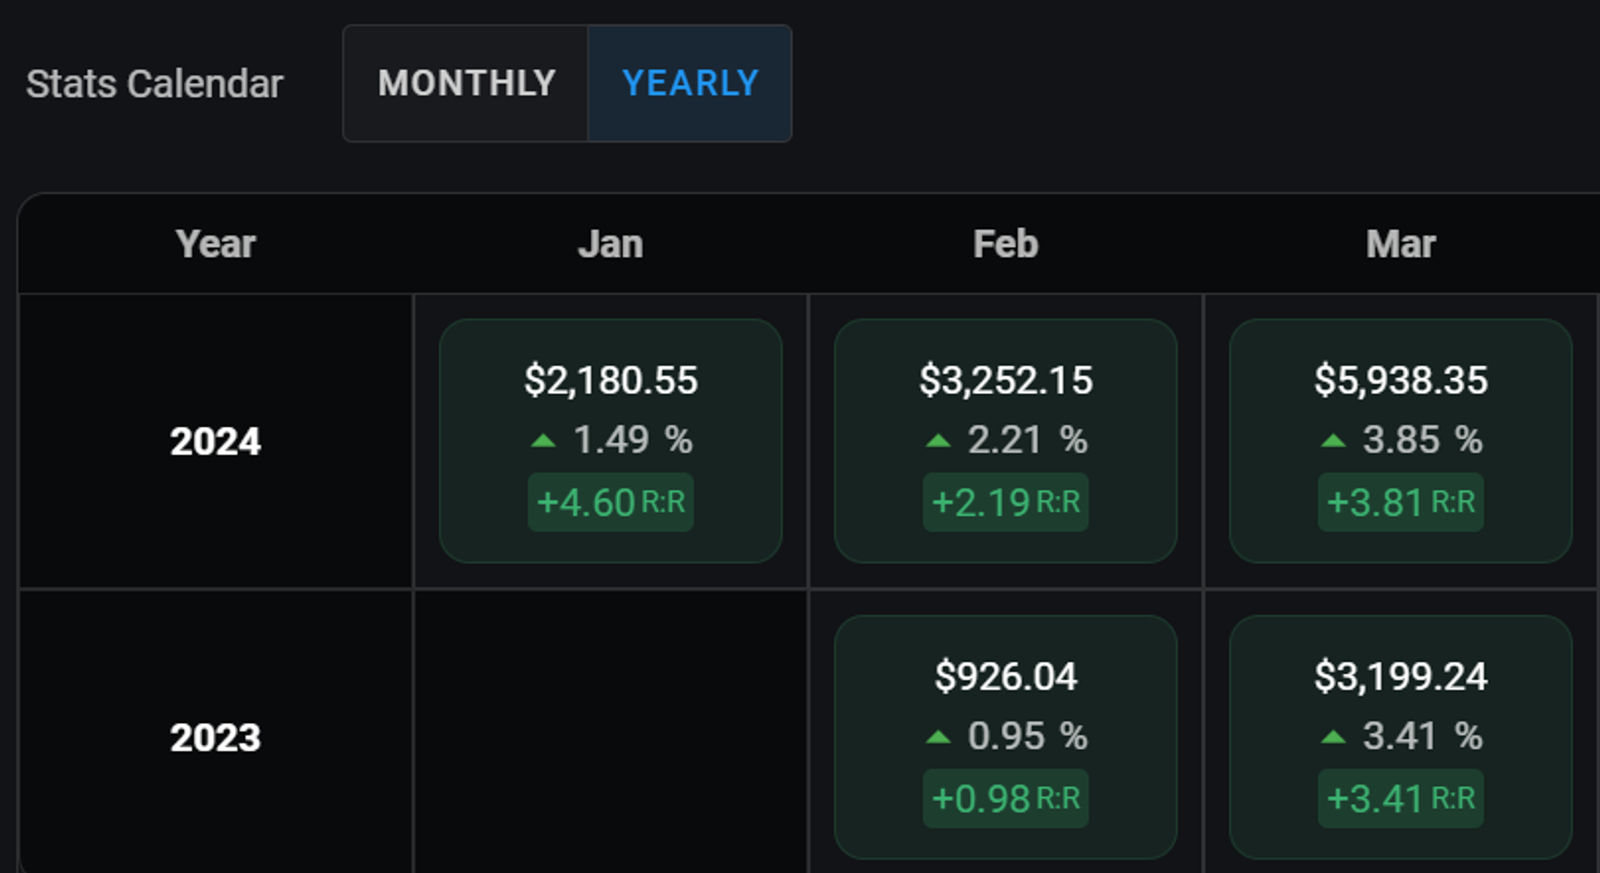
Screenshot of an online trading journal app named 'Trading Vault' displaying a yearly performance calendar for 2024. It shows monthly trade outcomes, including profits and losses in dollars, percentage changes, and reward-to-risk (RR) ratios.