Trading Vault Update: New Stat Widgets for Smarter Insights
Explore Trading Vault’s latest update with new stat widgets, improved averages, and enhanced performance tools designed to sharpen your trading edge.

Trading is all about understanding probability and having a profitable edge in the market.
A profitable edge is an indication of a higher probability of one thing happening over another. The key aspect here is “higher probability” and is therefore not a guaranteed outcome. When it comes to the markets nothing is ever a guarantee, however we do not need to know what will happen next to make money.
As traders we get our profitable edge by trading a strategy with a strict set of rules. In other words, our strategy tells us that when X, Y and Z occurs we can execute a trade knowing that there is a higher probability of price moving to our target rather than our stop.
We refer to this probability as our strike rate, and we can calculate that by dividing the number of winning trades by our total number of trades.
The relationship between our target and stop is our Reward:Risk Ratio (R:R). I.e. if my target is 50 pips from my entry and my stop is 25 pips from my entry. Then I have a 2:1 R:R trade.
Understanding the relationship between your strike rate and R:R can help you find and analyse your profitable edge in the market. This being, the lower our strike rate is, the higher our R:R needs to be, and vice versa. For example, if my strategy has an R:R of 3:1, then I only need to be right 31% of the time and I will be profitable.
This can be calculated with a simple formula, where our expected outcome is zero or breakeven.
R = (1 – Strike Rate) / Strike Rate
If we plot this on a graph, we can easily see the relationship. The curved line is our breakeven point. So, any strategy that has a strike rate and R:R to the right of that line is profitable over a large sample of trades. While anything to the left needs to be reviewed and tweaked.

Trading Vault can take care of all this for you. With all your trades recorded in your online trading journal, Trading Vault knows the Strike Rate and R:R of all your strategies and can plot each one individually on the graph. You can see how your strategies are performing without doing any of the calculations yourself. As you continue to record trades the graph is instantly updated so you can track your performance and always ensure your strategies have a profitable edge.


Explore Trading Vault’s latest update with new stat widgets, improved averages, and enhanced performance tools designed to sharpen your trading edge.

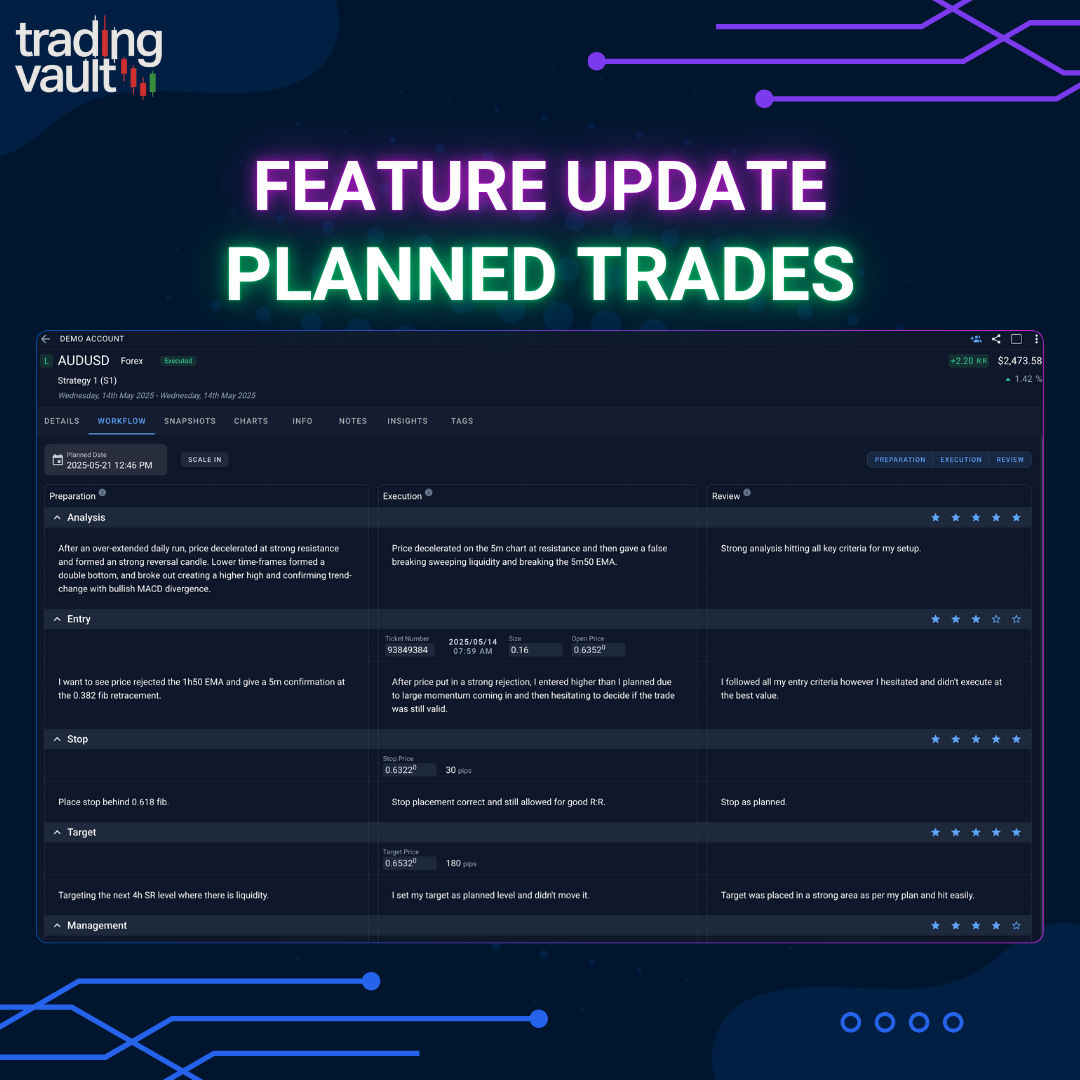
Unlock the full power of structured journaling with Trading Vault’s new Plan → Execute → Review workflow, ideal R:R tracking, and direction prediction.

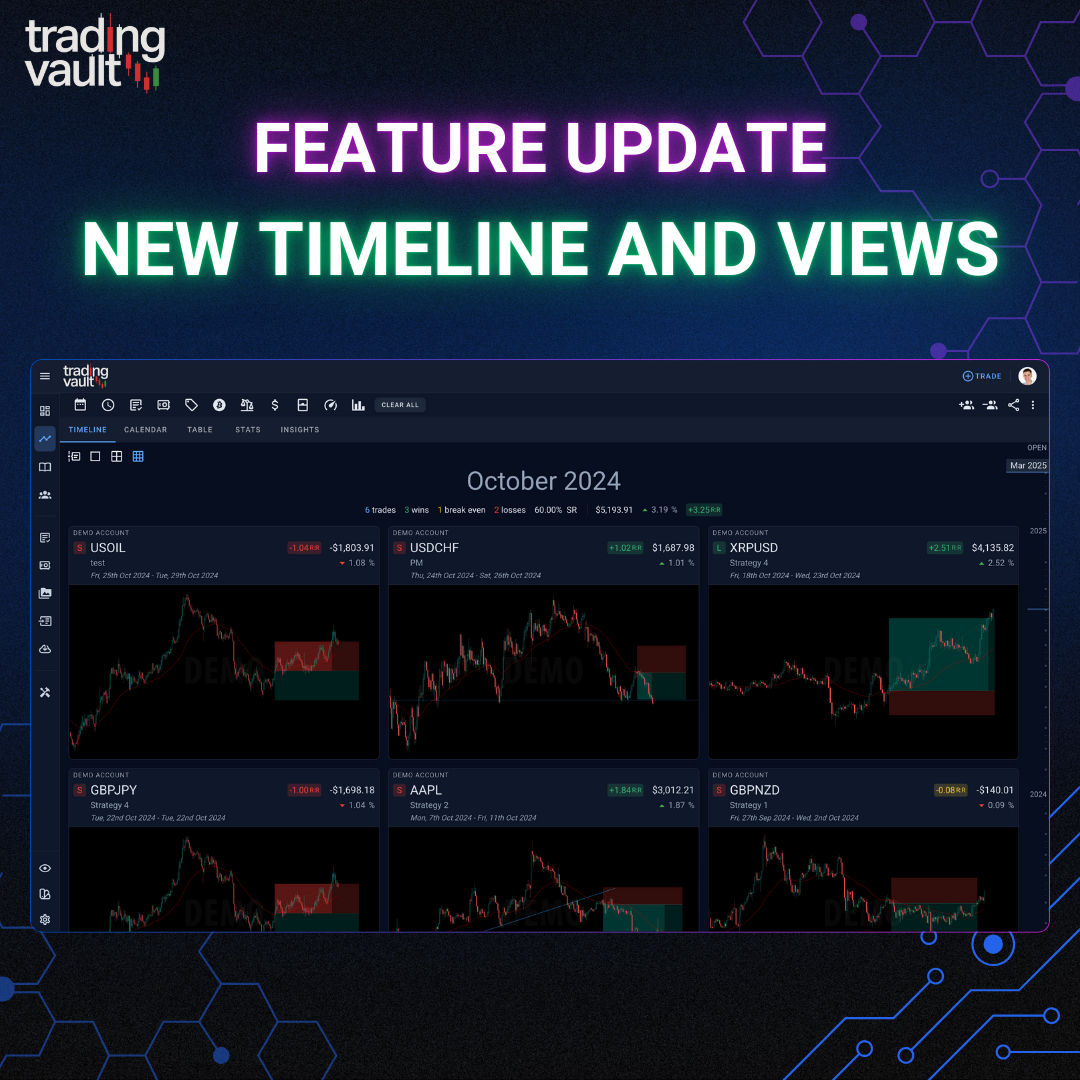
Trading Vault just got a huge upgrade to how you browse, filter, and review trades—with blazing fast views, timeline memory, and open trade filtering.