Trading Vault Update: New Stat Widgets for Smarter Insights
Explore Trading Vault’s latest update with new stat widgets, improved averages, and enhanced performance tools designed to sharpen your trading edge.

We are excited to announce the first of our Advanced Self Review features!
This update introduces the ability to record Maximum Adverse Price (MAP) and Maximum Favourable Price (MFP) for your trades.
You can now log this data directly in the trade's details table for each close position.
Using MAP and MFP, we’ve added nearly two dozen new stats to help analyze your trades, including:
These stats are presented in a new Info Tab, complete with a graph for visualizing price movements relative to your open, stop, target, and close prices.
For trades with multiple positions, dropdowns allow you to toggle between scale-ins and scale-outs, enabling granular analysis.
To complement the new stats, we've significantly expanded our stat filters, now organized into four categories:
This structure ensures easier navigation and greater flexibility during reviews.

We’re actively developing new widgets for the Stats screen to further utilize MAP and MFP data. Watch this space for updates!

Explore Trading Vault’s latest update with new stat widgets, improved averages, and enhanced performance tools designed to sharpen your trading edge.

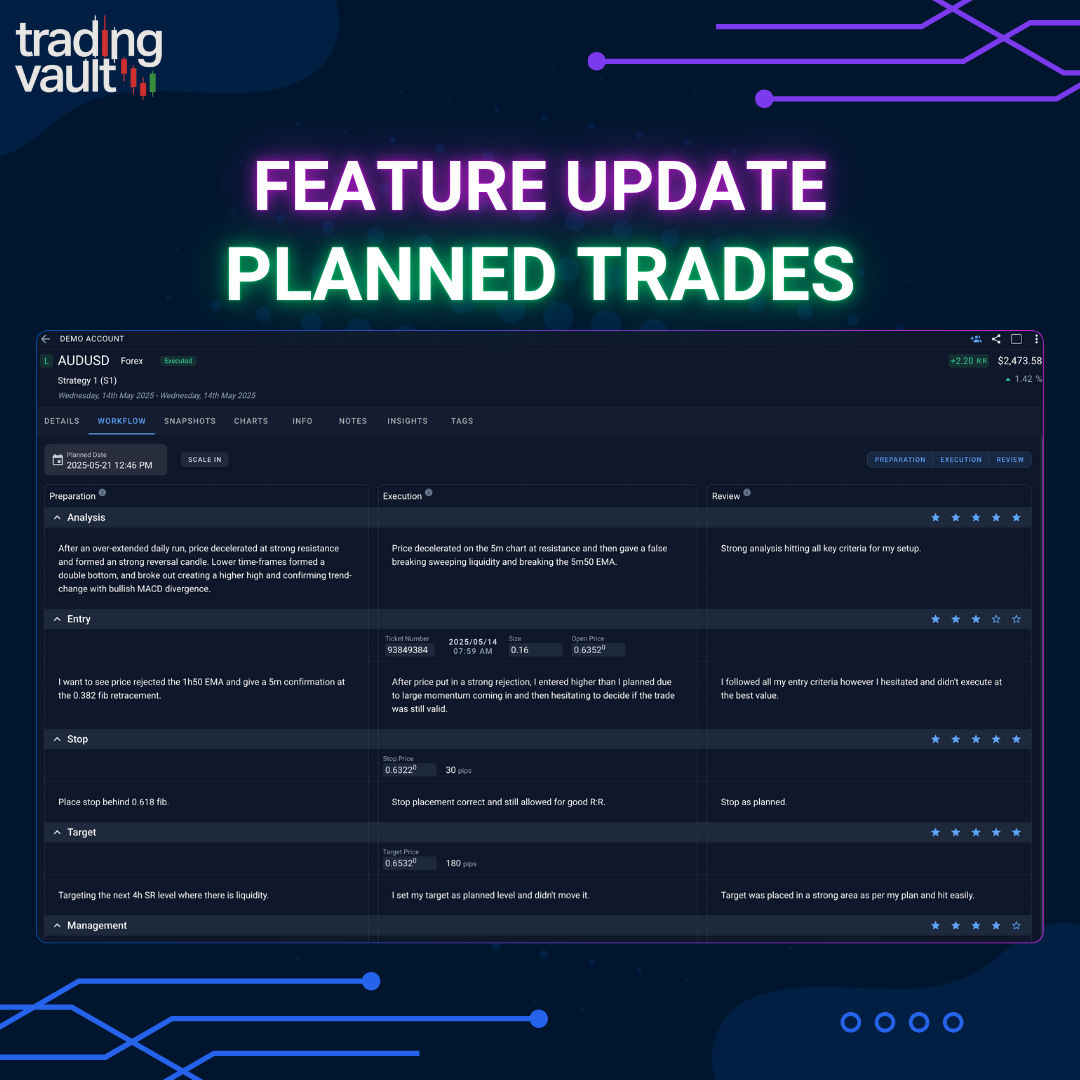
Unlock the full power of structured journaling with Trading Vault’s new Plan → Execute → Review workflow, ideal R:R tracking, and direction prediction.

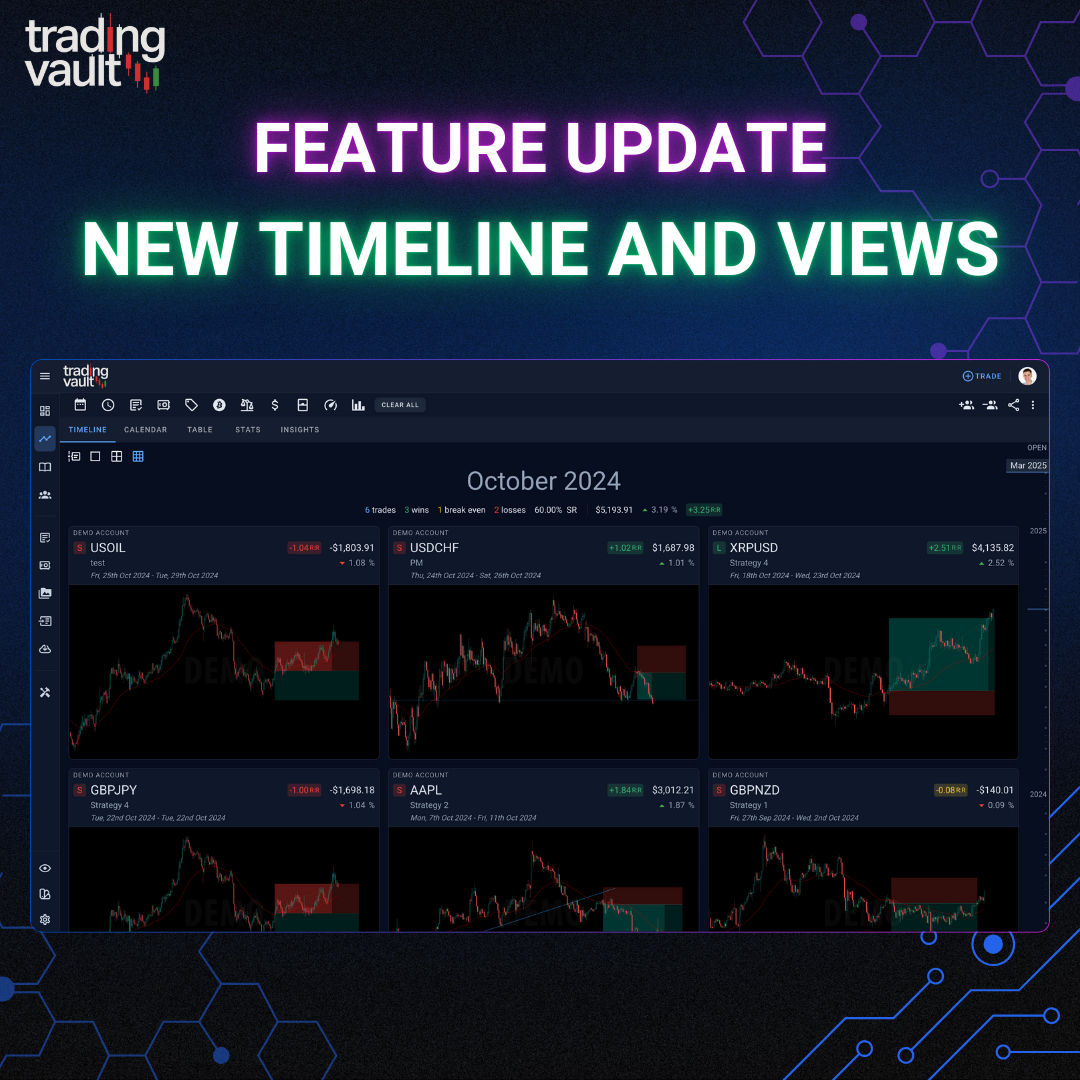
Trading Vault just got a huge upgrade to how you browse, filter, and review trades—with blazing fast views, timeline memory, and open trade filtering.