Trading Vault Update: New Stat Widgets for Smarter Insights
Explore Trading Vault’s latest update with new stat widgets, improved averages, and enhanced performance tools designed to sharpen your trading edge.

We've completely revamped the Stats pages in Trading Vault to bring you a cleaner interface and new ways to analyze your trades. 🚀

Each stat page now features:


We're working on additional updates for the Stats pages, so stay tuned for future releases!
As always, we value your feedback—drop us a message if you have ideas or suggestions.

Explore Trading Vault’s latest update with new stat widgets, improved averages, and enhanced performance tools designed to sharpen your trading edge.

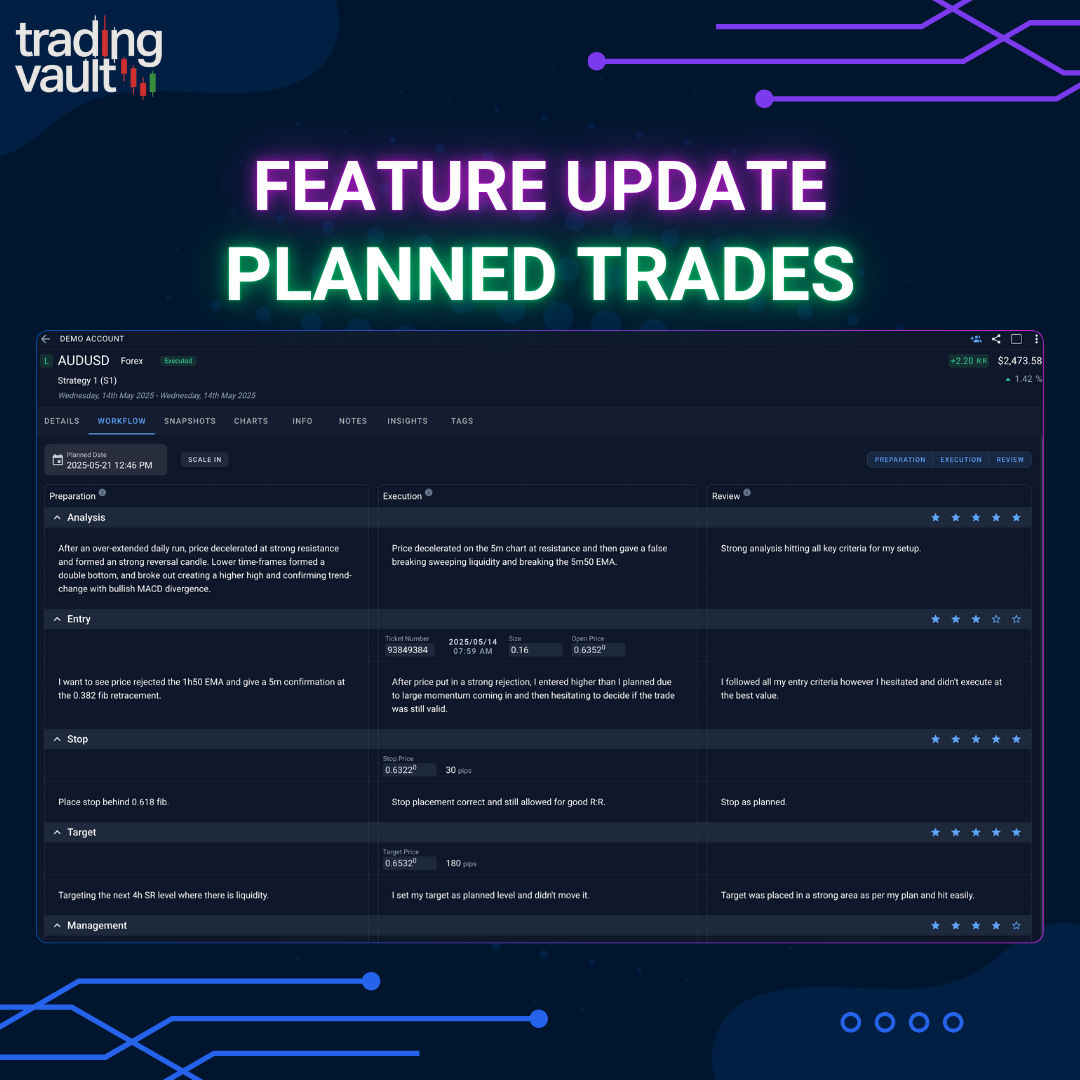
Unlock the full power of structured journaling with Trading Vault’s new Plan → Execute → Review workflow, ideal R:R tracking, and direction prediction.

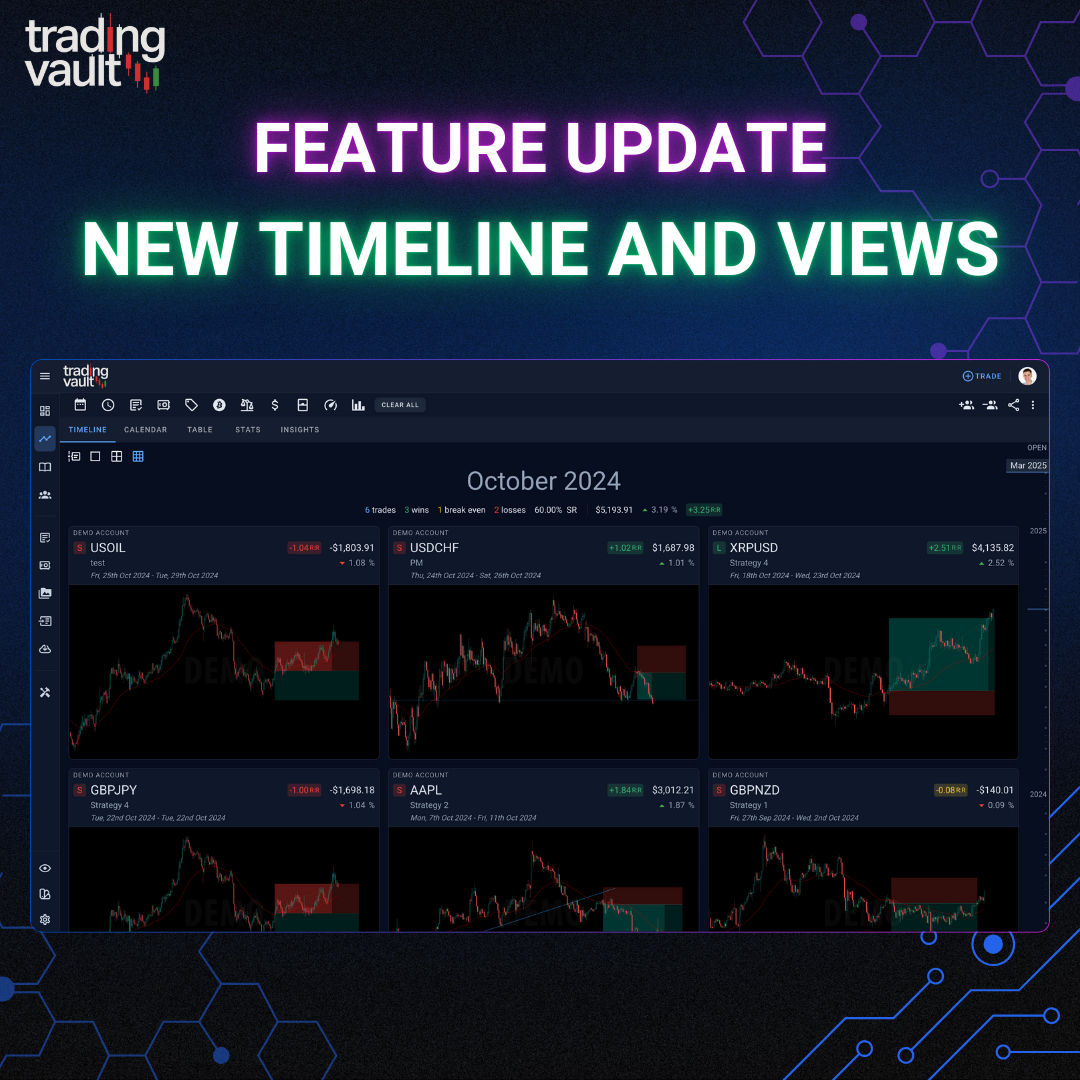
Trading Vault just got a huge upgrade to how you browse, filter, and review trades—with blazing fast views, timeline memory, and open trade filtering.