Trading Vault Update: New Stat Widgets for Smarter Insights
Explore Trading Vault’s latest update with new stat widgets, improved averages, and enhanced performance tools designed to sharpen your trading edge.

We are thrilled to introduce the Trade Performance Widget, now available on the stats pages for Pro members.
This powerful tool leverages the 21 new stats derived from Maximum Adverse Price (MAP) and Maximum Favourable Price (MFP) introduced in our last update.
The Trade Performance Widget empowers you to refine your strategies for maximized profitability. Here are some examples:
This tool is designed to be your go-to resource for identifying strengths and weaknesses in your trades. Start exploring the Trade Performance Widget today and unlock the full potential of your trading strategy.

Explore Trading Vault’s latest update with new stat widgets, improved averages, and enhanced performance tools designed to sharpen your trading edge.

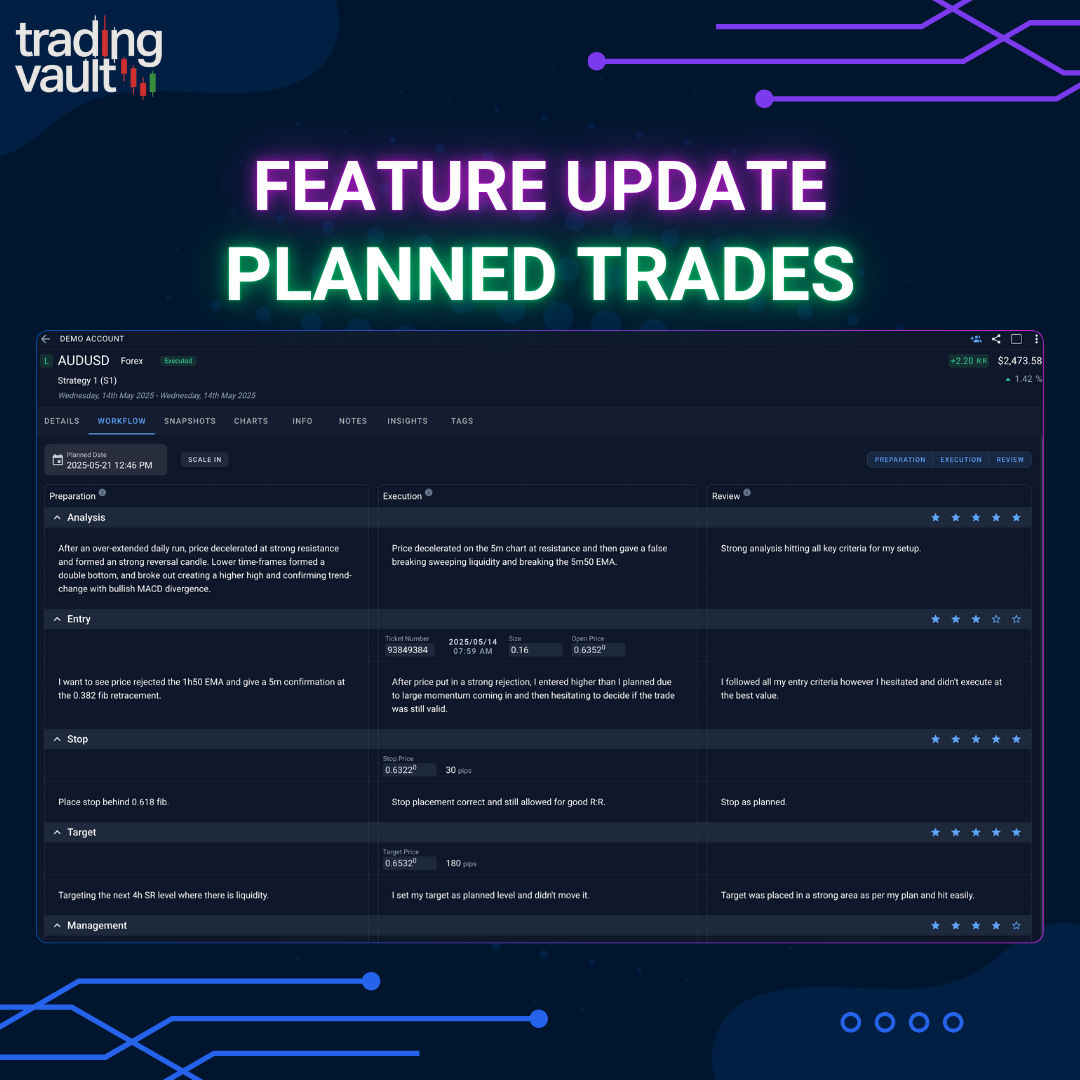
Unlock the full power of structured journaling with Trading Vault’s new Plan → Execute → Review workflow, ideal R:R tracking, and direction prediction.

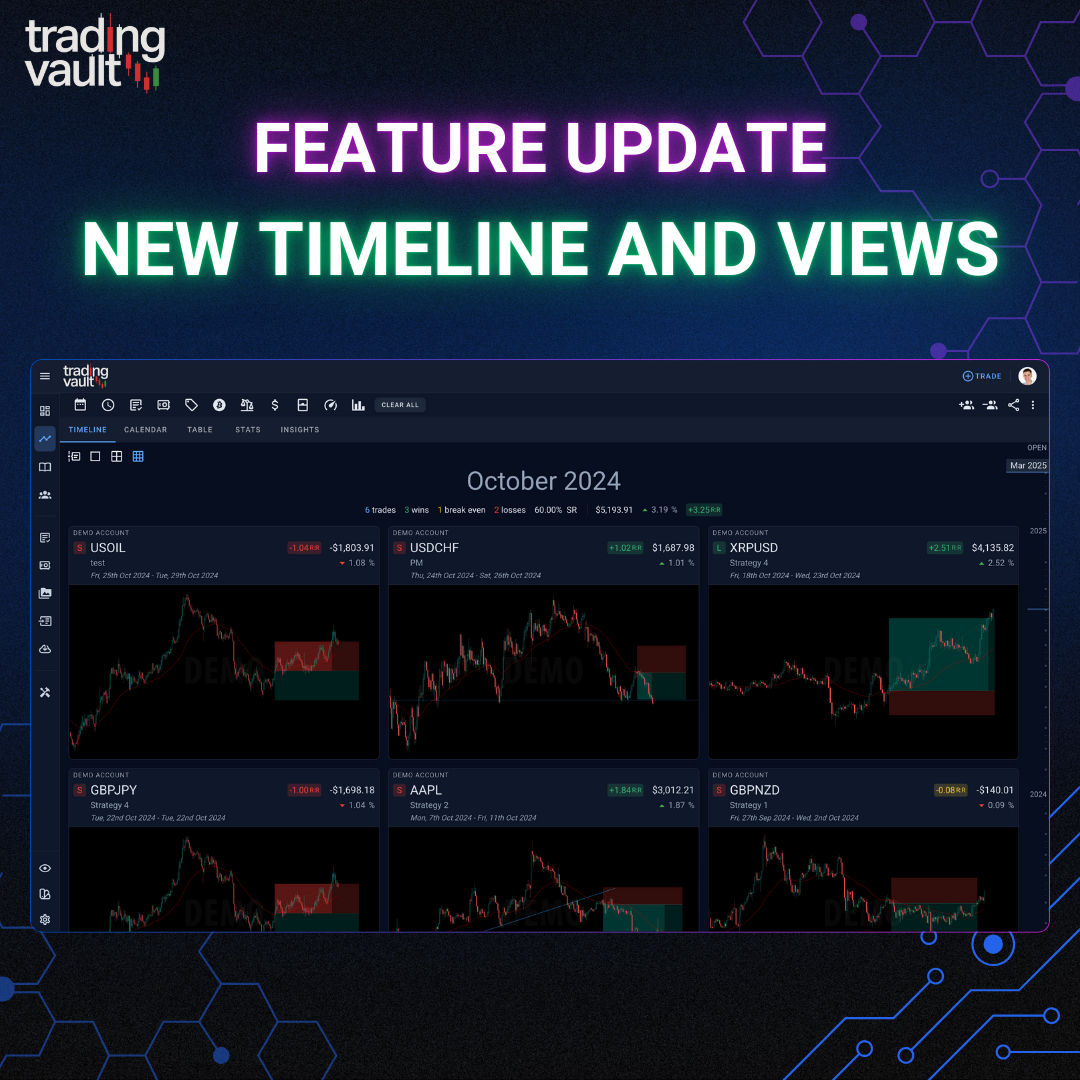
Trading Vault just got a huge upgrade to how you browse, filter, and review trades—with blazing fast views, timeline memory, and open trade filtering.