Dashboard
The dashboard provides a quick overview of your trading at a glance. You can change which account is displayed by selecting it at the top of the page.
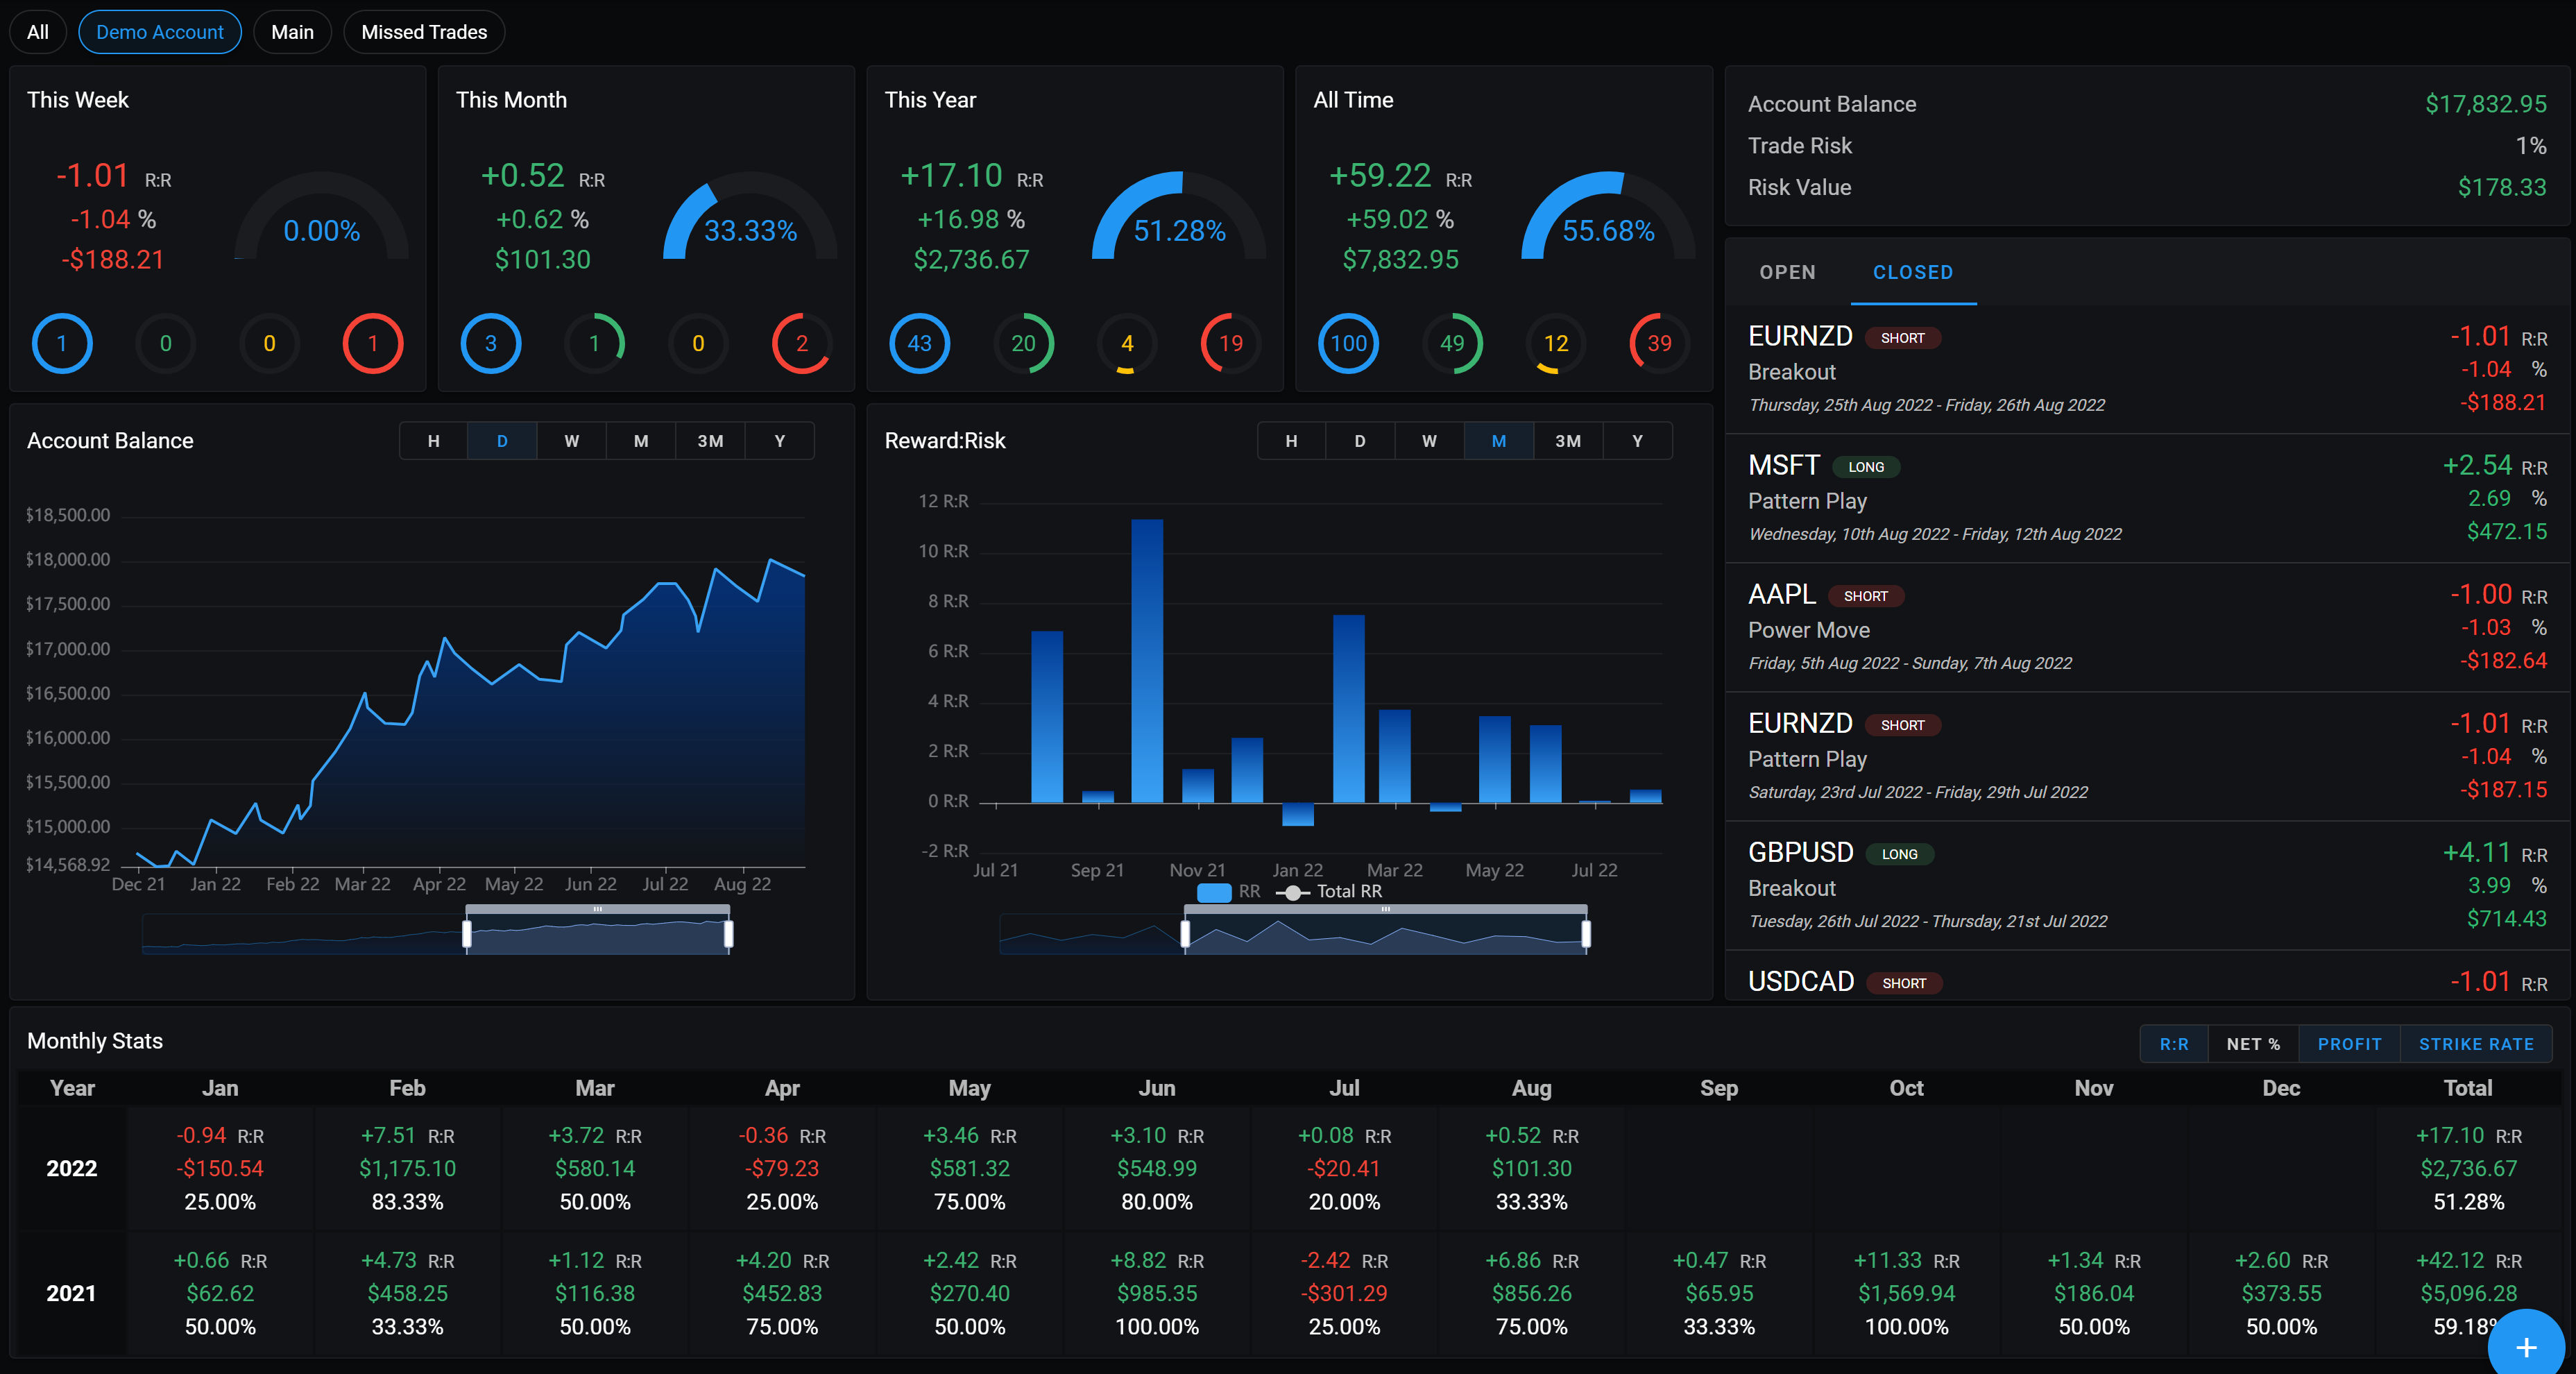
Performance widgets
The performance widgets give you a breakdown of your trading results for the current week, month, year and all time. They display your net profit, profit % return, reward:risk, strike rate, and number of wins, break-evens and losses for the given period.
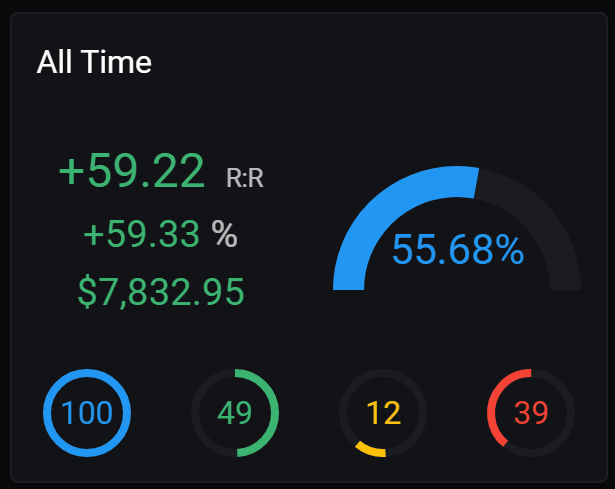
Account balance widget
The account balance widget acts as a quick reference of your account balance and desired risk per trade. The risk percentage can be configured from account management.

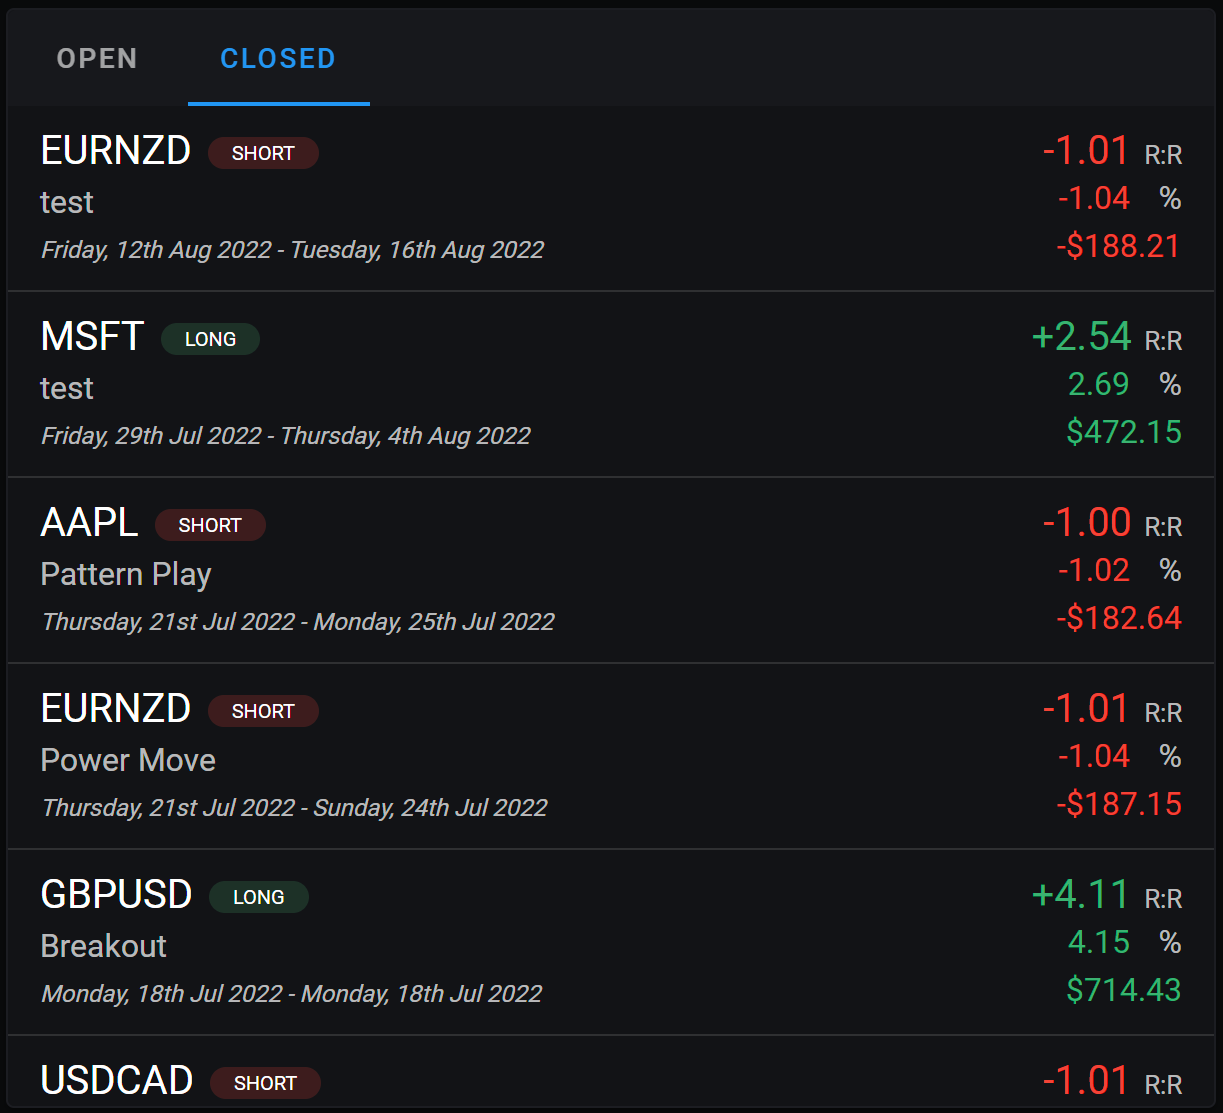
Open and closed trades widget
The Open and closed trades widget acts as a quick summary and short cut to view and open your trades. Use the tabs along the top to switch between open and closed trades. Click any trade to open it's trade details screen.
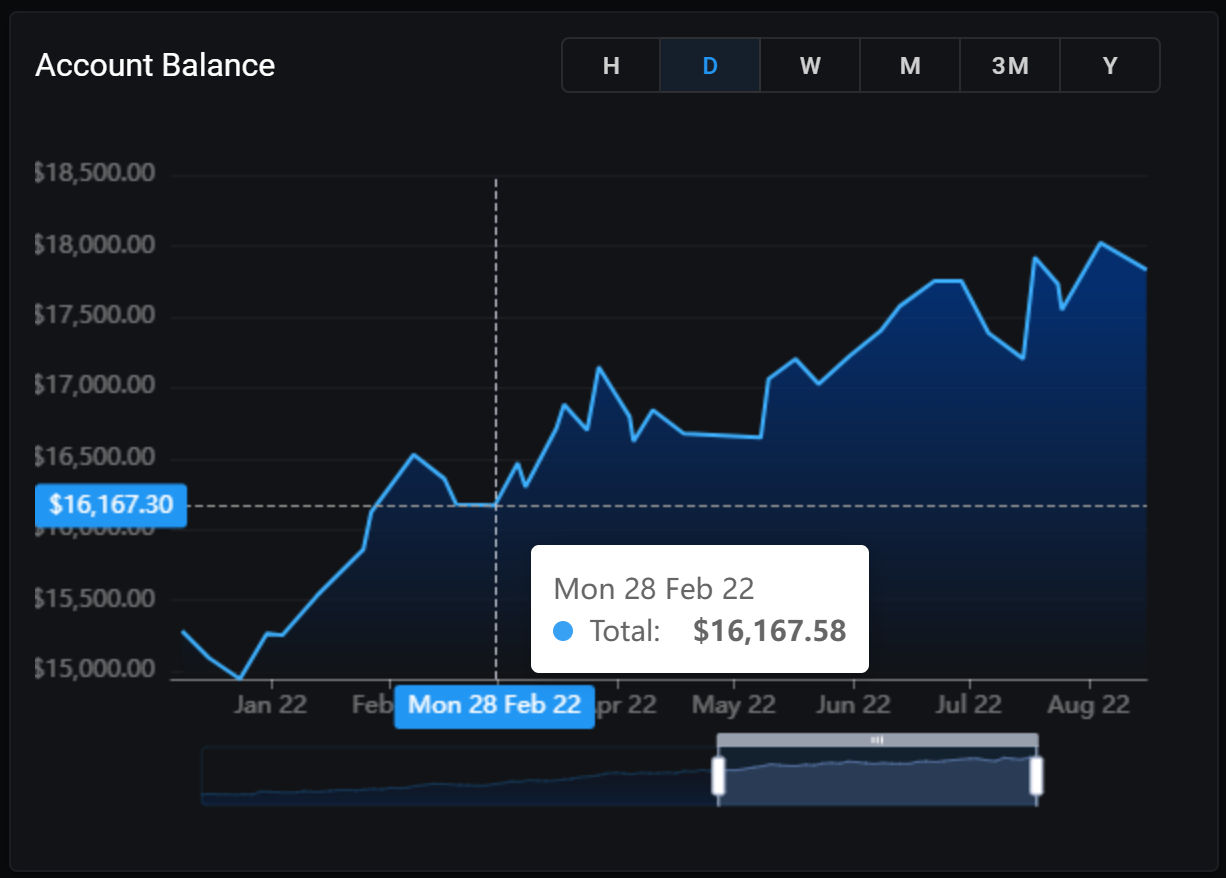
Account balance graph
The Account Balance Graph provides a graphical representation of the change in the value of your trading account over a time period. Use the buttons in the top right corner to change the time frame the graph is calculated in. The slider below the graph allows for easy panning and zooming.
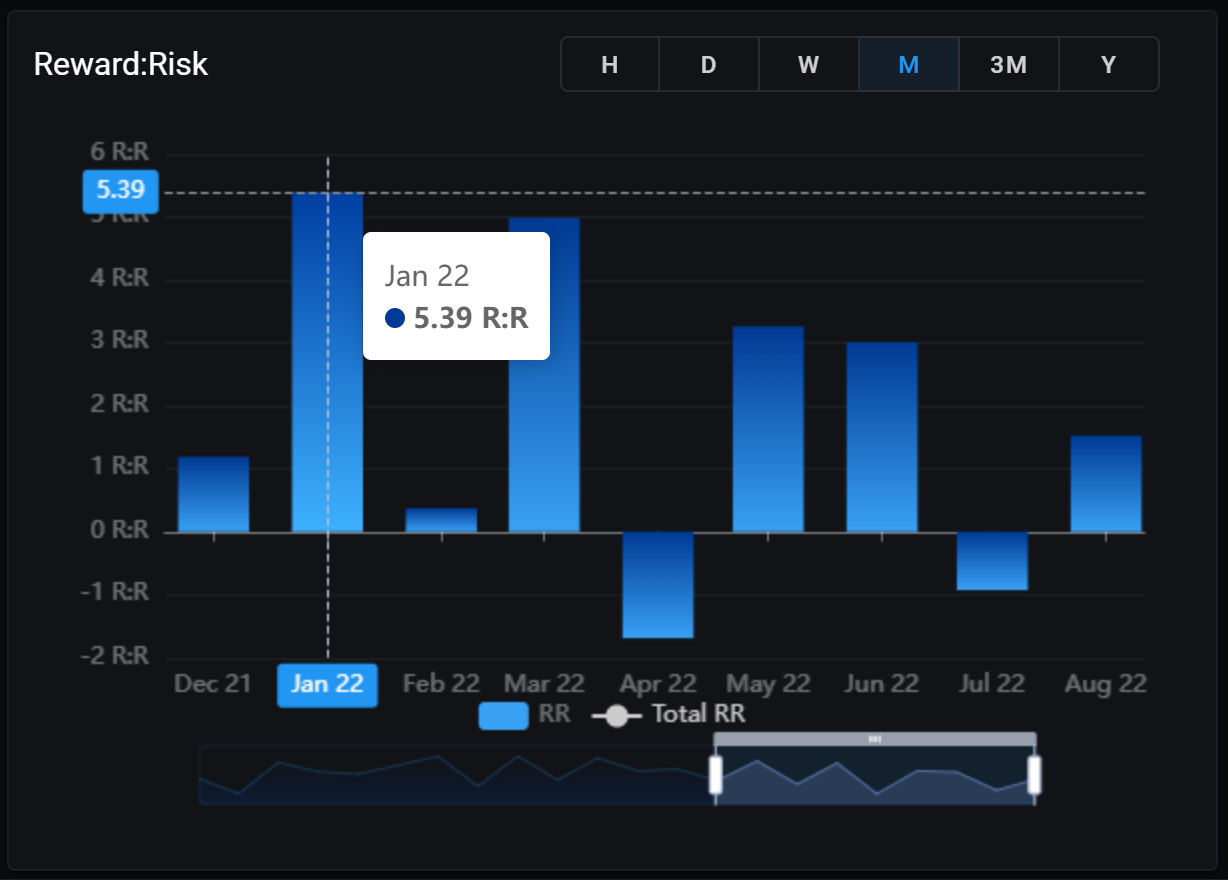
Reward:Risk graph
The Reward:Risk Graph depicts your accounts reward:risk over a time period. Use the buttons below the x-axis to change between monthly totals and a running balance of all trades. Use the buttons in the top right corner to change the time frame the graph is calculated in. The slider below the graph allows for easy panning and zooming.
Monthly stats widget
The Monthly Stats Widget provides a monthly breakdown of your trading results for quick reference and review. Use the buttons in the top right corner to change what is displayed. Mouse over a month or the year total for more information, or click a particular month or year to jump to the timeline screen to see the relevant trades.

Moderating Groups
Learn how to moderate your trading group on Trading Vault, including blocking trades, managing blocked trades, removing members, and modifying member roles.
Notebook
Trading Vault's Notebook feature allows you to keep track of your thoughts and ideas, jot down notes and observations, and record your progress as a trader. Customize your notes, group them into subnotes, and rearrange them as needed.