Timeline
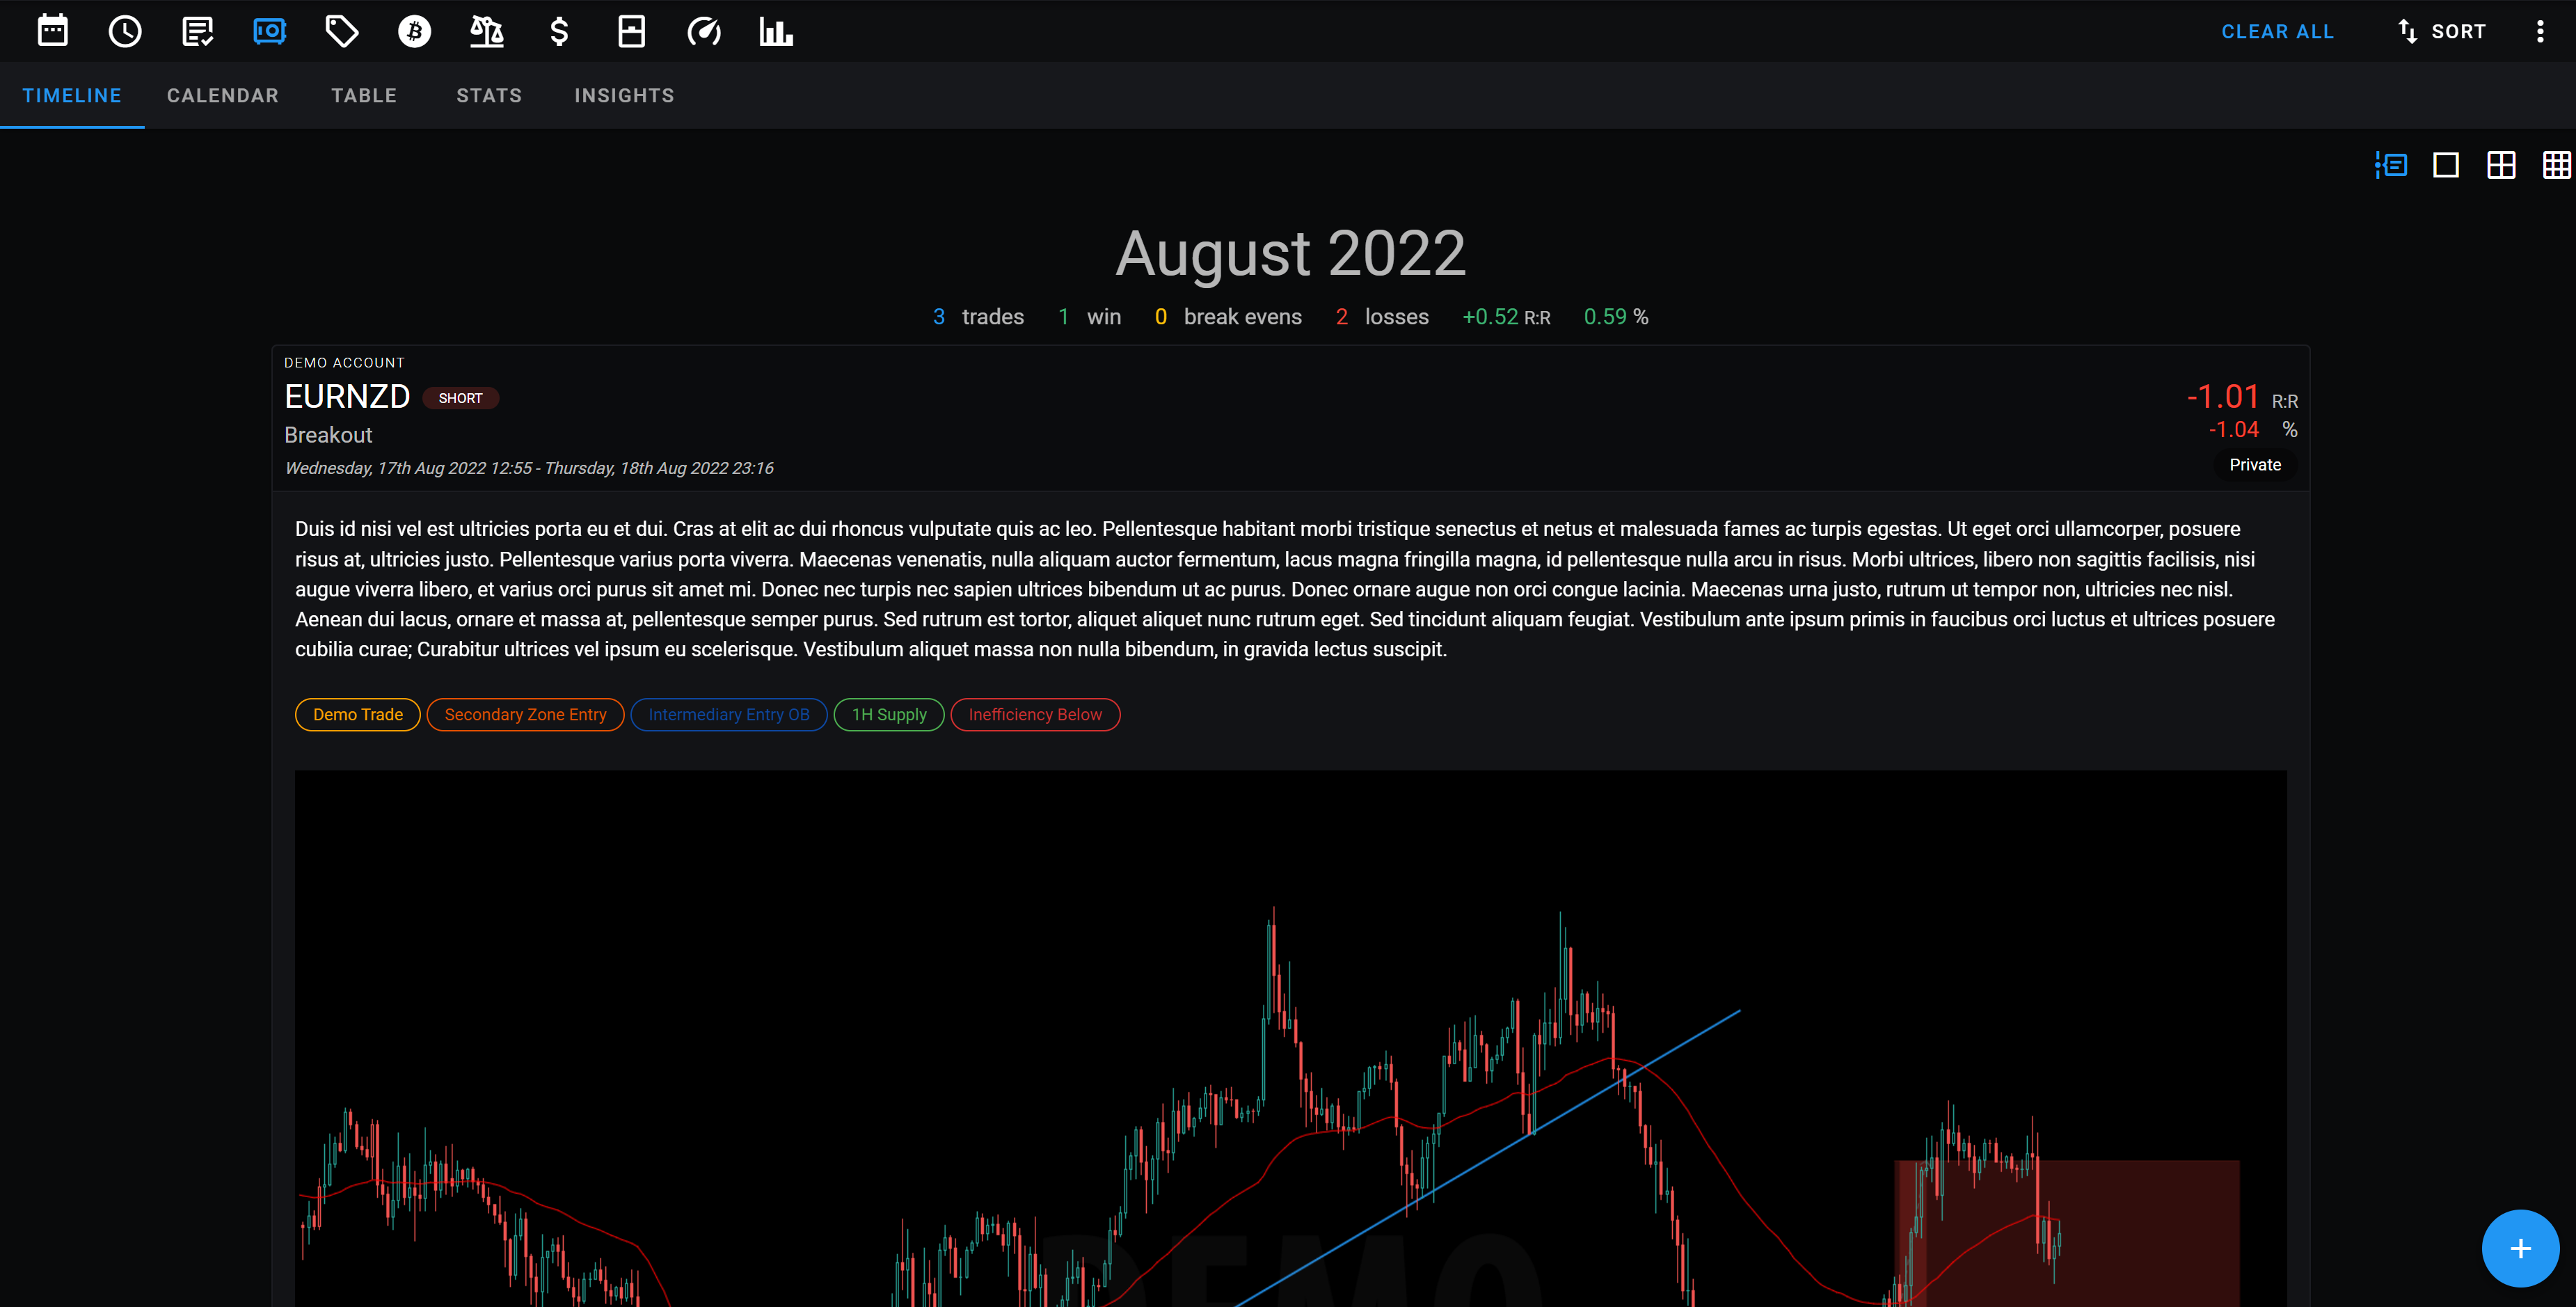
The timeline is a useful feature that allows you to view all your trades grouped by month. By default, the timeline displays each trade as a detailed trade card, which includes a summary of the trade and any snapshots you've attached to it. This provides a great tool for end of month reviews as you can quickly review each trade without having to open it. You can also cycle through each snapshot on a trade and click on one to view it full screen.

Gallery view
You can also switch to grid view, which shows a condensed version of each trade card in a grid layout. This is useful for quickly scanning your trades and finding specific ones. You can adjust the size of the trade cards in grid view by using the size buttons in the top right corner.
Filtering and Sorting
Trading Vault offers an advanced filtering system that persists as you navigate between different trade sections, allowing you to easily view and analyze specific sets of trades that meet your criteria without having to recreate the filters every time you switch between screens.
Calendar
The Trade Calendar feature on Trading Vault allows you to easily view your trades on a calendar and gain insights into patterns and trends in your trading behavior. Switch between daily, weekly, and monthly views depending on your preference.